Reshaping JPMorgan's Volatility, Capital, and Recovery
A T3-enabled Strategic Plan for JPMorgan Chase

PREFACE
JPMorgan Chase is one of the strongest banks in the world and still finds itself governed by forces it does not fully control: capital regulation, balance‑sheet intensity, and the way volatility punishes errors faster than growth rewards success. This report starts from that reality and asks a simple question: if you accept those constraints as non‑negotiable, where can technology actually change how the economics behave over time, rather than just adding more dashboards on top?
Through the S3 (Strategy Selection Support) service lens, JPMorgan is a multi‑engine enterprise whose returns are driven less by incremental margin tweaks than by capital efficiency and recovery dynamics. DuPont decomposition shows how different segments consume and earn on capital, while Monte Carlo simulation makes the asymmetry explicit: downside outcomes are frequent and severe, upside outcomes are muted and conditional, and slow recovery does most of the long‑term damage. Against that backdrop, the analysis isolates three T3‑enabled levers—reducing volatility, increasing capital velocity, and accelerating recovery—and treats them as a sequenced portfolio of moves rather than a grab bag of “digital initiatives.”
The result is not a promise of higher peak returns, but a disciplined path to a better outcome distribution: fewer and shallower bad years, a higher and more durable median, and faster compounding once conditions improve. The core question for leadership becomes, “How do we use advanced computing, networks, and related technologies to change how this balance sheet behaves under stress and recovery, without relaxing our risk discipline?” rather than “Which new products should we chase next?”

January 17, 2026
Dear Reader:
The following document was developed as an example to inform the followers of the Transformational Technology Tracker (T3) and the Strategy Selection Support (S3) service about how these tools can be utilized to assist corporate leaders and executives. It utilizes only publicly available information. It was not commissioned by JPMorgan Chase & Company. I will say, though, that as a former Partner and leader in more than one large, international management consulting firm, this document is just as credible and much more insightful than similar products I encountered over my 40+ years in business. The document represents my own perspective and recommendations, not necessarily those of the current executives or board members or shareholders at JPMorgan Chase & Company.
Bill Duncan
Founder and CEO, Transformational Technology Tracker
Founder and CEO, Strategy Selection Support
Executive Summary
This report demonstrates how insights about the transformational technologies emerging over the next several years can be applied in a disciplined, economically grounded way to improve strategic decisions under uncertainty. The objective is not to forecast markets, promote technology adoption, or advocate a single strategic path. It is to show—clearly and credibly—how deep economic understanding, combined with Transformational Technology Tracker (T3) intelligence, can be translated into durable strategic advantage.
JPMorgan enters the coming decade from a position of strength, yet operates in a strategic environment defined by heightened volatility, accelerating technological change, and increasing capital sensitivity. As with prior periods of technological acceleration, the defining characteristic of the coming cycle is not any single breakthrough or platform, but the simultaneous maturation and interaction of multiple foundational technologies—each advancing along its own trajectory while increasingly shaping, enabling, and constraining one another.
Using DuPont decomposition, the analysis establishes a clear economic foundation. Enterprise performance is governed less by incremental margin improvement than by capital efficiency, balance-sheet intensity, and the speed with which assets can be redeployed under changing conditions. Segment-level analysis further reveals meaningful divergence in performance drivers across the firm, underscoring the importance of enterprise-level coordination rather than uniform strategic prescriptions.
Monte Carlo simulation extends this analysis by examining how these structural drivers behave under uncertainty. The results demonstrate a persistent asymmetry: downside outcomes are frequent and economically severe, while upside outcomes are comparatively muted and conditional. Losses accumulate faster than gains are recovered, and recovery duration materially influences long-term performance. These tools do not predict the future; they clarify the forces that shape it—making visible where value is consistently created or destroyed and where strategic intervention offers the greatest leverage.
Against that foundation, T3 intelligence serves a specific and essential role. Rather than expanding the strategic agenda, it narrows it—identifying where recent technological progress changes relationships that historically could only be managed, not altered. In this context, the analysis reveals three opportunities—validated through DuPont analysis and Monte Carlo simulation—that are economically decisive, temporally distinct, and mutually reinforcing: Volatility Reduction, Capital Velocity Acceleration, and Recovery Acceleration.
These opportunities align with specific transformation windows identified in the T3 roadmap and are sequenced to protect flexibility while compounding advantage. Importantly, the strategy that emerges is neither defensive nor speculative. It does not depend on optimistic demand assumptions, single-technology bets, or irreversible commitments. Growth remains part of the strategy, but it is earned, staged, and validated rather than assumed.
Opportunity-adjusted Monte Carlo analysis confirms that these applications plausibly reshape enterprise outcomes. The modeled results show materially improved downside performance, higher median outcomes, and substantially shorter recovery periods—achieved without relaxing risk discipline or relying on favorable external conditions.
The broader implication extends beyond JPMorgan. This work demonstrates that T3 intelligence is most powerful when it is applied after economic constraints are understood, not before. Used in this way, T3 does not replace strategic judgment; it sharpens it—allowing leadership teams to distinguish between what is merely possible and what is economically decisive.
In a decade defined by volatility, capital intensity, and accelerating technological change, the ability to align transformation with economics will separate resilient enterprises from fragile ones. Applying the intelligence and insights of T3 turns that challenge into an advantage.
Section 2: Company Background
2.0 Purpose of the Background Section
This background section establishes the economic and regulatory context within which JPMorgan Chase & Company operates. Its purpose is not descriptive completeness, but analytical grounding: to define the constraints, return mechanics, and industry structures that govern enterprise performance before any decomposition, simulation, or technology discussion is introduced.
For a Global Systemically Important Bank (G-SIB), enterprise outcomes are shaped less by managerial discretion than by capital regulation, balance-sheet economics, and asymmetric downside behavior. Understanding those forces is essential to interpreting the DuPont and Monte Carlo analyses that follow.
2.1 Industry Structure: Large-Scale Banking as a Regulated Capital Business
Large U.S. banking is not a conventional services industry. It is a capital-intensive, balance-sheet-driven industry in which returns are structurally bounded by regulation, liquidity requirements, and systemic risk controls.
At an industry level, returns are governed by:
Regulatory capital ratios (CET1, leverage, stress buffers)
Liquidity coverage and funding stability
Credit loss cyclicality
Interest-rate sensitivity and duration mismatches
As a result, industry ROE does not scale linearly with growth. Incremental assets frequently consume regulatory capital faster than they generate incremental earnings capacity, particularly in wholesale and market-facing activities.
Historically, large U.S. banks have generated mid-teens ROE in favorable environments, with materially lower returns once volatility, stress periods, and recovery dynamics are incorporated. These industry characteristics define the economic envelope within which JPMorgan operates.
2.2 Regulatory and Policy Constraints on Earnings Power
JPMorgan’s earnings capacity is explicitly capped by regulation, not by market competition alone.
Key binding constraints include:
CET1 and leverage requirements, which limit balance-sheet expansion
Stress testing (CCAR), which constrains capital distribution and forces conservative buffers
Liquidity coverage rules, which reduce asset velocity
Resolution and G-SIB surcharges, which raise effective capital intensity as scale increases
Critically, these constraints tighten during periods of stress—precisely when earnings weaken. This creates an inherent asymmetry: downside outcomes increase capital requirements at the same time that profitability declines, while upside outcomes are capped by regulatory ceilings.
These mechanics explain why JPMorgan’s strategic challenge is not maximizing peak returns, but managing volatility, capital efficiency, and recovery speed.
2.3 JPMorgan’s Enterprise Scale and Structural Position
As of year-end 2024, JPMorgan Chase & Co. reported approximately:
$4.0 trillion in total assets
$177.6 billion in total net revenue (managed basis)
$58.5 billion in net income
Firmwide ROE of ~18%
JPMorgan is the largest U.S. bank by assets and one of the most systemically important financial institutions globally. Its scale confers funding advantages, diversification benefits, and market access—but it also places the firm at the most binding end of the regulatory spectrum.
Scale is therefore a necessary but insufficient condition for superior performance. Beyond a certain point, additional scale increases capital burden and downside exposure faster than it increases sustainable returns.
2.4 Enterprise Organization and Segment Economics
JPMorgan operates as a multi-engine enterprise, not a monolithic bank. Following its 2024 reorganization, the firm reports three primary business segments:
Consumer & Community Banking (CCB)
A high-volume, capital-efficient consumer banking engine driven by net interest income and scale economics.Commercial & Investment Bank (CIB)
A capital-intensive wholesale engine spanning investment banking, markets, and large-corporate banking; dominant in asset usage and downside exposure.Asset & Wealth Management (AWM)
A capital-light, fee-based engine with high margins and the strongest ROE profile.
These segments differ materially in:
Balance-sheet intensity
Return on equity
Volatility exposure
Sensitivity to capital constraints
Firmwide performance is therefore a portfolio outcome, not the result of uniform economics.
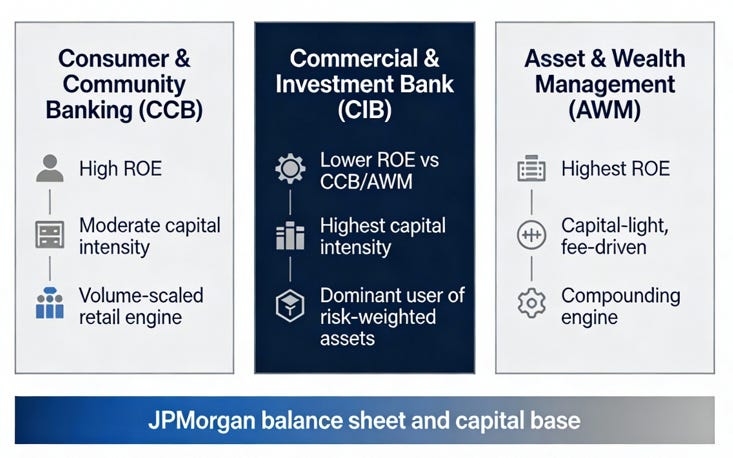
Figure 1: JPMorgan as a multi‑engine enterprise—CCB and AWM as higher‑ROE, capital‑efficient engines and CIB as the capital‑intensive, downside‑dominant engine sharing a single balance sheet and capital base.
2.5 Earnings Trajectory and Competitive Context
JPMorgan’s earnings performance has consistently exceeded that of most large-bank peers, particularly in stress periods. This outperformance is driven by:
Segment diversification
Strong risk management
Scale-driven operating leverage
However, this relative strength does not remove the underlying constraints shared across the industry. It mitigates volatility through diversification rather than eliminating capital intensity or downside asymmetry.
In practical terms, JPMorgan outperforms within the industry’s structural limits—not outside them.
2.6 Market Stability, Demand Characteristics, and Competitive Dynamics
Demand for banking services is cyclical and highly correlated with macroeconomic conditions. Credit demand, trading activity, and fee income all fluctuate with economic and market regimes.
Switching costs for large institutional and consumer clients are meaningful but not prohibitive. Competitive dynamics are shaped less by new entry—which is rare at scale—and more by regulatory parity and capital availability among incumbents.
Industry entry and exit at scale is infrequent, reinforcing stability but also entrenching capital-based competition.
2.7 Implications for Economic Analysis
The background facts establish several critical conditions:
JPMorgan’s outcomes are governed by capital efficiency, not unconstrained growth.
Downside behavior and recovery dynamics dominate long-run performance.
Segment economics differ structurally and persistently.
Regulatory constraints are binding and non-negotiable.
These conditions define why DuPont decomposition and Monte Carlo simulation are the appropriate analytical tools—and where strategic intervention can plausibly matter.
2.8 Section Summary
JPMorgan Chase operates within a highly regulated, capital-intensive industry where returns are structurally bounded and downside asymmetry is unavoidable. The firm’s scale and diversification confer resilience, but they do not remove regulatory or balance-sheet constraints.
Understanding these industry and firm-specific mechanics is essential to interpreting the DuPont and Monte Carlo analyses that follow. They explain why value creation depends less on growth initiatives and more on volatility reduction, capital efficiency, and recovery acceleration—the precise dimensions explored in subsequent sections.
Section 3: Observed Facts - What the Economics Already Tell Us
This section establishes a set of observed facts about JPMorgan Chase & Co.’s economic behavior. These are not interpretations, forecasts, or strategic prescriptions. They are empirical observations derived from publicly reported segment results, balance-sheet structure, regulatory constraints, and historical performance patterns.
The purpose is to identify which forces consistently dominate outcomes—across environments—so that subsequent analysis can focus on the constraints that actually matter.
3.1 JPMorgan Is a Multi-Engine Enterprise with Divergent Return Profiles
JPMorgan does not operate as a single economic engine. Its three primary client-facing segments—Consumer & Community Banking (CCB), Commercial & Investment Bank (CIB), and Asset & Wealth Management (AWM)—exhibit materially different return characteristics, capital intensity, and volatility profiles.
Observed facts include:
AWM and CCB generate materially higher segment ROE than the firmwide average, while consuming a smaller share of balance-sheet assets.
CIB dominates asset usage, but produces lower ROE relative to AWM and CCB due to capital intensity, risk-weighted asset consumption, and cyclicality.
Firmwide performance therefore reflects portfolio weighting, not uniform economics.
These divergences are structural, not transient. They persist across cycles and interest-rate regimes.
(See Appendix G: Segment Economics and Return Profiles)
3.2 Balance-Sheet Scale Is a Necessary Condition, Not a Sufficient One
JPMorgan’s scale provides diversification, funding advantages, and market presence. However, observed returns do not increase linearly with balance-sheet growth.
Empirical evidence shows:
Incremental asset growth frequently consumes regulatory capital faster than it releases earnings capacity.
Regulatory leverage and CET1 constraints cap the economic benefit of expansion unless capital efficiency improves concurrently.
As a result, diminishing marginal returns to scale are observable at the enterprise level.
This makes JPMorgan’s economic challenge fundamentally different from that of a lightly regulated services firm. Growth without efficiency improvement does not reliably improve outcomes. (Capital efficiency and leverage constraints are formalized in Appendix F.)
3.3 Downside Outcomes Are Structurally Amplified
Across historical stress periods, JPMorgan’s downside outcomes exhibit a consistent asymmetry:
Credit losses, market shocks, and operational disruptions increase risk-weighted assets precisely when earnings weaken.
Capital buffers must be preserved or rebuilt during downturns, limiting flexibility.
Recovery of returns typically lags recovery of revenue.
This asymmetry means that losses accumulate faster than gains are recovered, even for a best-in-class institution. (Downside asymmetry and tail behavior are quantified in the baseline Monte Carlo results in Appendix K.)
3.4 Earnings Stability Is Achieved Through Diversification, Not Through Constraint Removal
JPMorgan’s relative earnings stability versus peers is real—but it is achieved primarily through business-line diversification, not through elimination of underlying constraints.
Observed patterns include:
Volatility is redistributed across segments rather than removed.
Weakness in one segment is often offset by strength in another, but the capital base remains fully exposed.
Enterprise ROE therefore reflects averaging, not structural relief.
This distinction is critical. Diversification smooths reported earnings, but it does not reduce capital intensity or accelerate recovery once constraints bind. (See Appendix K: Monte Carlo Methodology and Baseline Results)
3.5 Decision Latency and Human Mediation Remain Structurally Embedded
Despite substantial technology investment, key enterprise decisions—credit adjudication, risk pricing, capital reallocation—remain heavily mediated by human processes and layered controls.
Observed consequences include:
Latency between signal detection and action, especially under stress.
Conservative bias that protects against error but delays reallocation.
Limited ability to dynamically rebalance capital and risk at enterprise scale.
These characteristics are rational responses to regulatory and fiduciary obligations, but they also represent a structural constraint on economic agility. (See Appendix K: Monte Carlo Methodology and Baseline Results)
3.6 What These Facts Imply—and What They Do Not
Taken together, these observed facts imply:
JPMorgan’s outcomes are governed less by revenue growth than by capital efficiency, risk timing, and recovery dynamics.
The most economically decisive levers are those that alter how capital and risk respond under uncertainty, not those that simply expand activity.
Importantly, these facts do not imply strategic weakness. JPMorgan remains one of the strongest financial institutions globally. They do imply, however, that incremental optimization alone cannot materially change outcome distributions.
That implication defines the analytical task ahead.
3.7 Section Summary
JPMorgan’s economics are dominated by balance-sheet constraints, regulatory capital requirements, and asymmetric downside behavior. Segment diversification stabilizes earnings but does not eliminate capital intensity or recovery lag. Human-mediated decision structures protect safety but impose latency.
These observed facts establish the foundation for the next stage of analysis: decomposing returns formally through a DuPont framework and quantifying how these constraints shape outcome distributions under uncertainty. (These conclusions are derived directly from the DuPont decomposition in Appendix F and the baseline Monte Carlo distributions in Appendix K.)
Section 4: DuPont Decomposition - Enterprise and Segment Return Drivers
This section formalizes the economic structure underlying JPMorgan Chase & Co.’s returns by decomposing return on equity (ROE) into its fundamental drivers. The objective is not to optimize accounting ratios, but to identify which components of return dominate outcomes under regulatory constraint and uncertainty.
For a Global Systemically Important Bank, leverage is regulated rather than discretionary, asset growth is capital-bound, and downside outcomes alter capital requirements precisely when earnings weaken. As a result, understanding how margin, asset utilization, and regulated leverage interact is essential before any discussion of strategy or technology.
The DuPont framework provides that structure.
4.1 Enterprise-Level DuPont Decomposition
At the enterprise level, ROE can be expressed as:
ROE = (Net Income / Revenue) × (Revenue / Assets) × (Assets / Equity)
Using JPMorgan’s most recent full fiscal year (FY2024), the enterprise DuPont decomposition is shown in Appendix F.
Key observations:
Margin is strong by industry standards, reflecting pricing power, fee diversity, and scale advantages.
Asset turnover is structurally low, a consequence of balance-sheet intensity and regulatory capital treatment.
Leverage is capped by regulation, not management preference.
As a result, enterprise ROE is governed less by incremental revenue growth than by capital efficiency and risk-weighted asset behavior.
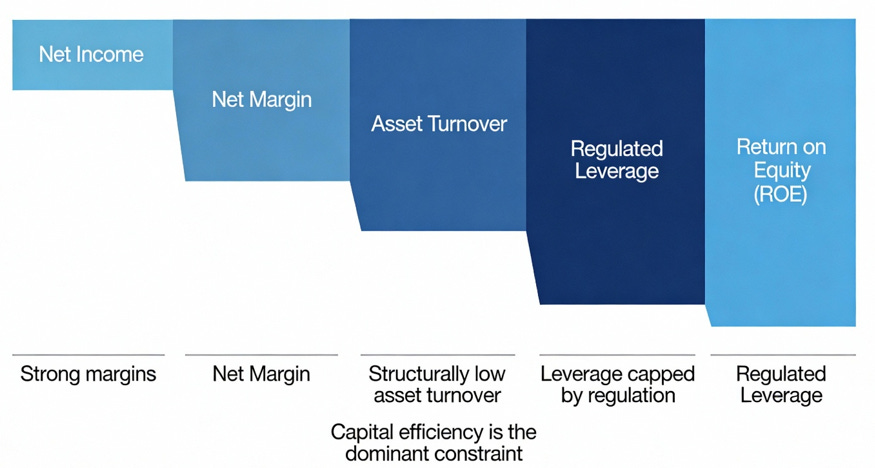
Figure 2: Illustrative DuPont waterfall for JPMorgan—showing strong margins, structurally low asset turnover, and regulated leverage combining to govern enterprise ROE under capital constraints.
Implication: Improvements in any single term are insufficient unless they alter how capital is consumed and released under uncertainty. (See Appendix F: Enterprise DuPont Decomposition)
4.2 Segment-Level DuPont Decomposition: A Multi-Engine Enterprise
JPMorgan’s enterprise results mask substantial variation across its operating segments. Segment-level DuPont decomposition reveals three distinct economic engines with different constraints and sensitivities.
Consumer & Community Banking (CCB)
High margins driven by net interest income and scale efficiencies
Moderate asset turnover
Strong ROE relative to firmwide average
CCB behaves as a capital-efficient, volume-scaled engine, but remains sensitive to credit cycles and consumer stress.
Commercial & Investment Bank (CIB)
Lower margins due to capital intensity and market volatility
Very low asset turnover given balance-sheet usage
ROE constrained by risk-weighted asset density
CIB is the dominant consumer of enterprise capital, and the primary source of downside asymmetry under stress.
Asset & Wealth Management (AWM)
High margins driven by fee-based revenue
Very low balance-sheet intensity
Highest ROE among segments
AWM operates as a capital-light compounding engine, with returns governed more by client assets than by balance-sheet scale.
These differences are structural and persistent. (Full segment-level DuPont waterfalls and allocation notes are provided in Appendices J1–J5.)
4.3 What the DuPont Model Makes Explicit
Across both enterprise and segment views, several facts become unavoidable:
Leverage is not a strategic lever
Regulatory capital requirements cap leverage and tighten under stress.Asset growth does not guarantee return expansion
Incremental assets often consume capital faster than they generate earnings.Downside behavior dominates outcome distributions
Losses and volatility increase capital requirements precisely when profitability weakens.Return improvement requires altering constraint behavior, not just optimizing performance
These realities define the boundaries within which strategy must operate.
4.4 Section Summary
The DuPont decomposition shows that JPMorgan’s returns are governed by capital efficiency under regulatory constraint, not by scale alone. Segment economics differ materially, with capital-intensive businesses dominating downside risk while capital-light businesses drive return quality.
This structure explains why traditional growth strategies produce diminishing returns and why reducing downside asymmetry is economically decisive.
The next step is to translate this static structure into probabilistic behavior under uncertainty using Monte Carlo analysis.
Section 5: Monte Carlo Analysis: Enterprise Economic Behavior Under Uncertainty
5.1 Purpose and Role of Monte Carlo Analysis
The DuPont models developed in the prior section describe how JPMorgan Chase’s enterprise economics are structured under a given set of conditions. They clarify how revenue, margins, and capital intensity combine to produce return on net assets (RONA). However, they do not address a critical question faced by executives and boards: how those economics behave under uncertainty across time.
Monte Carlo analysis fills that gap. Rather than producing a single-point forecast, it simulates thousands of plausible future paths based on historically observed variability in JPMorgan’s core economic drivers. The objective is not prediction, but probabilistic understanding—to observe the distribution of outcomes the enterprise is likely to experience given its current economic structure.
This approach is particularly appropriate for a large, diversified financial institution. Banking performance is shaped not by steady-state averages, but by volatility, correlation, and tail behavior across credit cycles, market regimes, and funding environments. Small changes in revenue, margin, or capital dynamics can compound meaningfully over time. Monte Carlo analysis makes those effects visible.
5.2 Simulation Framework and Design
The baseline simulation models JPMorgan Chase at the enterprise level, consistent with how capital adequacy, regulatory stress, and shareholder returns are ultimately assessed.
Key design features:
Time horizon: 10 years
Simulation runs: 10,000 iterations
Time step: Annual
Primary output: Distribution of enterprise RONA outcomes
Each simulation year recomputes RONA using the same DuPont identity established earlier:
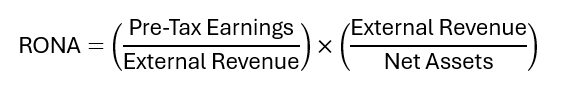
Uncertainty is introduced by allowing the underlying drivers—revenue, margins, and capital base—to vary according to historically anchored distributions.
5.3 Modeled Economic Drivers
The baseline Monte Carlo focuses deliberately on a small number of dominant variables. These drivers capture the majority of enterprise volatility without introducing unnecessary complexity.
1. External Revenue Variability
Total net revenue is modeled using a growth-rate distribution derived from JPMorgan’s historical revenue behavior across multiple cycles, including periods of market stress and recovery.
Mean annual growth reflects long-run enterprise expansion.
Volatility captures market-driven swings, interest-rate sensitivity, and investment banking cyclicality.
Extreme outcomes are constrained to prevent implausible tails.
2. Pre-Tax Margin Variability
Pre-tax margin (income before tax divided by revenue) reflects:
Credit loss cycles
Trading and markets volatility
Operating leverage
Expense discipline
Margin variability is modeled independently of revenue growth, consistent with observed historical behavior in which profitability fluctuates materially even when revenues are stable.
3. Net Asset Base Stability
Net assets (common equity) are treated as relatively stable over the simulation horizon, reflecting regulatory capital management, retained earnings, and disciplined balance sheet growth. This assumption isolates economic volatility, rather than balance-sheet engineering, as the primary driver of outcome dispersion in the baseline case.
5.4 Simulation Outputs and Observations
The simulation produces a distribution of enterprise RONA outcomes, rather than a single expected value.
Several structural characteristics emerge:
Outcome dispersion is asymmetric.
Downside outcomes occur more frequently and are more severe than upside outcomes of comparable magnitude. This reflects the combined effect of margin compression and revenue contraction occurring simultaneously during stress periods.Median performance is materially lower than peak-year results.
While JPMorgan is capable of generating strong RONA in favorable environments, those outcomes are episodic. The median path reflects a materially lower return once volatility is incorporated.Recovery dynamics matter more than peak performance.
The simulations show that the enterprise’s long-run economics are shaped less by how high returns rise in good years than by how quickly performance recovers following adverse ones.Capital efficiency dominates tail outcomes.
Variability in net asset turns—driven by revenue behavior relative to a largely fixed capital base—plays a greater role in downside outcomes than incremental margin changes.
These findings reinforce a core conclusion: enterprise fragility is structural, not cyclical. It arises from how JPMorgan’s economics are constructed, not from isolated events.
5.5 Quantitative Results from the Baseline Simulation
The baseline Monte Carlo simulation produces a wide and asymmetric distribution of enterprise RONA outcomes over the 10‑year horizon. Median performance clusters materially below recent peak‑year results, while downside outcomes occur with greater frequency and magnitude than upside outcomes of comparable scale. (Percentile ranges and distribution charts supporting these observations are presented in Appendix K.)
Across the simulation, the median annual enterprise RONA falls in the 11–13% range, reflecting the central tendency of JPMorgan’s economics once historical volatility is incorporated. In contrast, the lower decile of outcomes (P10) shows RONA compressing into the 7–9% range, with severe downside years (P5) falling to approximately 5–6%. These outcomes are not driven by extraordinary assumptions; they emerge naturally from historically observed variability in revenue, margins, and credit‑related performance.
Upside outcomes are notably more constrained. Even in favorable sequences, the upper decile of outcomes (P90) produces RONA in the 15–17% range, with extreme upside limited by capital intensity and regulatory constraints. In other words, JPMorgan’s enterprise economics exhibit a clear asymmetry: downside outcomes are both more frequent and more severe than upside gains are large or persistent.
The simulation further shows that periods of stress produce rapid and nonlinear deterioration, with RONA declining by 20–30% from median levels within one to two years under adverse conditions. Recovery, by contrast, is slower and more incremental, with performance reverting toward the median over multiple years rather than rebounding sharply. This dynamic mirrors historical experience and underscores why volatility, rather than average growth, dominates long‑term economic outcomes.
Taken together, these quantitative results describe how JPMorgan’s economics behave under uncertainty given its current structure. Before introducing any T3‑enabled changes, it is essential to recognize how far the firm has already advanced along the frontier of risk, capital, and control technology.
5.6 What JPMorgan Already Does
JPMorgan already operates at the frontier of risk, capital, and control technology by industry standards. The firm runs comprehensive CCAR and Dodd‑Frank stress‑testing processes, using model‑based projections of credit losses, portfolio migrations, and macro‑driven delinquency behavior to shape capital buffers and distribution decisions. It applies advanced analytics across wholesale and consumer credit books, using model‑based approaches, credit‑migration models, and cash‑flow simulations to assess risk across segments and asset classes.
Beyond regulatory stress testing, JPMorgan has invested heavily in AI‑enabled risk and control infrastructure. Machine‑learning models screen payments and card activity in real time to detect fraud, materially reducing manual review and preventing significant losses, and AI‑driven systems support credit‑risk assessment, portfolio monitoring, and anomaly detection across businesses. In transaction banking and treasury, the firm offers sophisticated technology to clients—real‑time liquidity tools, virtual account structures, and automated cash‑management solutions—that free working capital and improve capital efficiency at the corporate level.
These capabilities capture much of the current best‑practice frontier in stress testing, fraud detection, and data‑driven risk management. They nonetheless remain largely application‑specific and siloed: models and controls are optimized within products, portfolios, and regulatory processes rather than orchestrated as a single, predictive enterprise‑control system that continuously rebalances risk, capital, and growth across segments. Decisions are still mediated by human committees and sequential processes, which introduces latency between signal detection and action—especially under stress. This is precisely where T3 intelligence creates a new opportunity: not to replace JPMorgan’s existing risk infrastructure, but to connect and extend it so that enterprise‑level volatility reduction, capital‑velocity gains, and faster recovery become engineered outcomes rather than by‑products of strong local practices.
5.7 Implications for Strategy Formation
Taken together, the baseline Monte Carlo distribution and JPMorgan’s existing risk and control infrastructure define a high but not insurmountable performance frontier. The firm is already sophisticated in its use of models, data, and controls, yet the simulations show that enterprise outcomes remain structurally asymmetric and volatility‑dominated.
The analysis identifies where economic risk concentrates, which drivers dominate downside exposure, and why reducing volatility and improving capital efficiency offer more leverage than chasing incremental growth. It does not prescribe actions; instead, it defines the economic battlefield—the conditions under which strategic interventions must operate to be meaningful.
The next step is to determine where transformational technologies can change these dominant relationships rather than merely manage them—specifically, where T3 applications can raise the downside floor, truncate left‑tail outcomes, and accelerate recovery without relaxing risk discipline. This question motivates the T3 opportunity analysis that follows.
Section 6: Applying T3 to Shift Enterprise Outcome Distributions
6.1 Framing the Strategic Question
The Monte Carlo analysis in Section 5 establishes a clear and consequential baseline: JPMorgan’s enterprise economics are structurally asymmetric. Downside outcomes occur more frequently and with greater severity than upside outcomes of comparable scale, and RONA compresses rapidly during stress periods—often by 20–30% within one to two years—while recovery toward median performance is slower and more incremental.
The strategic question, therefore, is not how to improve peak‑year results. It is how to alter the shape of the outcome distribution itself—specifically, how to raise the downside floor, reduce left‑tail severity, and accelerate recovery when adverse conditions occur.
This is the point at which Transformational Technology Tracker (T3) intelligence becomes decisive. T3 is not applied broadly or aspirationally; it is applied only where the Monte Carlo analysis shows that small structural changes can produce outsized effects on enterprise outcomes.
6.2 Criteria for T3 Application
To maintain analytical discipline and avoid technology‑driven distraction, an initiative qualifies for inclusion in this analysis only if it satisfies all three of the following criteria:
Constraint relevance
The initiative must act directly on one or more of the dominant drivers of downside outcomes identified in the Monte Carlo baseline—revenue volatility, margin compression, capital rigidity, or recovery lag.
Distributional impact
The initiative must plausibly change not just expected performance, but the distribution of outcomes—by truncating tail risk, reducing variance, or shifting the median upward.
Enterprise materiality
The effect must be large enough, and broad enough, to matter at the consolidated enterprise level, even if execution occurs within specific business segments.
Applying these criteria yields a small number of economically decisive opportunities, rather than a long list of attractive but marginal initiatives. The following subsections focus on three such opportunities that align tightly with the constraints revealed by DuPont and Monte Carlo analysis.
6.3 Opportunity 1: Reducing Volatility Through Predictive Enterprise Control
Constraint addressed
The Monte Carlo baseline shows that revenue and margin volatility—particularly during stress periods—is the primary driver of rapid RONA deterioration. These effects are amplified by delayed detection and slow, sequential response across complex and distributed operating systems.
T3 technologies applied
Advanced Computing enables large‑scale pattern recognition, predictive modeling, and optimization across high‑dimensional enterprise data.
Networks & Communications enables low‑latency data movement and coordination across distributed systems, allowing insights generated by advanced computing to be acted upon in time to matter.
Mechanism of impact
The convergence of Advanced Computing and Networks & Communications enables continuously updated, predictive representations of complex operating systems. In industry practice, these capabilities are often referred to as “digital twin” systems—not as a distinct technology category, but as an application pattern made possible by the maturation and integration of these two T3 technologies.
Applied to trading activity, credit exposure, liquidity management, and cost control, these capabilities allow JPMorgan to identify stress signals earlier, evaluate response options more rapidly, and intervene before losses compound. The resulting architecture is illustrated schematically in Figure 3, which shows how predictive sensing, modeling, and coordinated interventions truncate downside tails in the enterprise outcome distribution.
Monte Carlo implication
This opportunity primarily reduces left‑tail severity (P10 and P5 outcomes) and shortens recovery cycles. Because the baseline distribution is asymmetric, even modest reductions in volatility materially improve long‑run enterprise outcomes, raising the downside floor without relying on more aggressive risk‑taking.
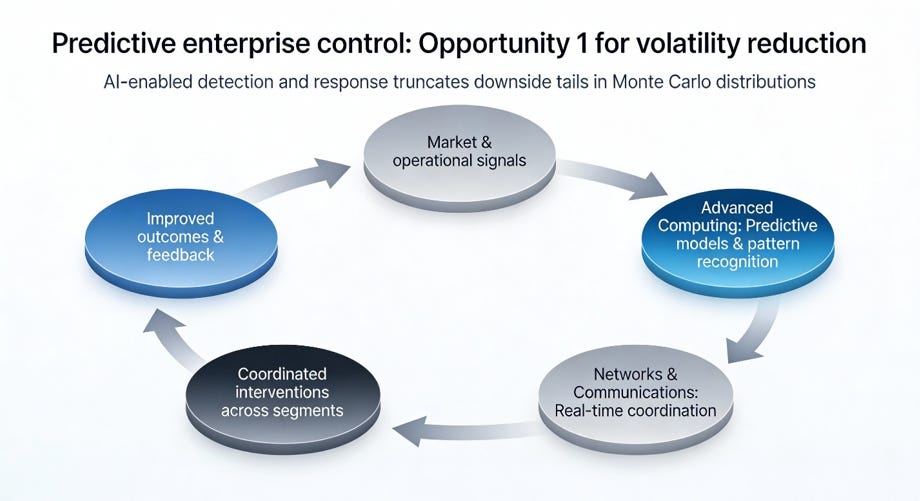
Figure 3: Predictive enterprise control for Opportunity 1—AI‑enabled sensing, modeling, and coordinated interventions that reduce volatility by truncating downside tails in JPMorgan’s Monte Carlo outcome distribution.
6.4 Opportunity 2: Increasing Capital Velocity Without Increasing Risk
Constraint Addressed
Monte Carlo results show that capital rigidity, rather than margin alone, limits upside performance and accelerates downside compression. Net assets remain relatively fixed while revenues and earnings fluctuate, amplifying RONA volatility through changes in net asset turns.
T3 Technologies Applied
Advanced Computing — enables real-time optimization of capital allocation, risk-weighted asset efficiency, and scenario evaluation at a scale not previously feasible.
Networks & Communications — enables enterprise-wide visibility and coordination, allowing capital decisions to propagate across business units rapidly rather than through slow, hierarchical processes.
Mechanism of Impact
Together, these technologies allow capital allocation to be treated as a dynamically optimized system rather than a static constraint. What is often described operationally as “capital agility” or “systems modernization” is, in fact, the practical consequence of applying Advanced Computing and Networks & Communications to balance-sheet management.
The result is improved capital velocity—the ability to allocate, reallocate, or constrain capital more efficiently—without increasing leverage or risk appetite.
Monte Carlo Implication
This intervention raises the median RONA and narrows the distribution by moderating the nonlinear amplification effects observed in downturns. The impact is structural rather than cyclical, making it persistent across environments.
6.5 Opportunity 3: Accelerating Recovery Through Segment-Specific T3 Deployment
Constraint Addressed
Monte Carlo paths show that recovery lag, not just initial decline, materially erodes long-term performance. Time spent below median outcomes compounds value loss even when peak performance eventually returns.
T3 Technologies Applied
Advanced Computing — enables faster normalization of credit underwriting, servicing, and risk management across consumer, commercial, and investment banking activities.
Networks & Communications — enables coordinated recovery across segments by reducing information and execution delays.
Advanced Materials — over longer horizons, enable structural improvements in infrastructure durability and efficiency, reducing failure rates, maintenance downtime, and capital drag.
Quantum Technologies — while earlier-stage, offer future potential in optimization, sensing, and cryptographic security; their strategic relevance lies in preparatory investment and architectural readiness rather than near-term deployment.
Mechanism of Impact
Targeted deployment of these T3 technologies within specific segments reduces friction precisely where recovery historically stalls. What is sometimes described as “systems resilience” is not itself a technology, but an emergent property of infrastructure built on more capable computing, communications, and materials foundations.
Monte Carlo Implication
These interventions primarily reduce time spent underperforming—shortening recovery cycles and improving cumulative outcomes across stress–recovery sequences, even if peak performance remains unchanged.
6.6 Strategic Interpretation
Taken together, these opportunities do not attempt to forecast favorable conditions or rely on optimistic assumptions. They work by changing how JPMorgan behaves when conditions are unfavorable.
From a Monte Carlo perspective, their combined effect is expected to:
Lift the downside floor
Reduce tail risk
Improve the durability of median outcomes
Increase long-run capital efficiency
This reframes T3 not as a source of speculative growth, but as a distribution-shaping instrument—one that converts volatility from a persistent liability into a managed variable.
6.7 Transition to Quantification
The next step is to test these interventions quantitatively.
In Section 10, the baseline Monte Carlo simulation is re-run with explicit, conservative adjustments to the underlying driver distributions—reflecting reduced volatility, improved capital velocity, and faster recovery. The objective is not to promise outcomes, but to demonstrate plausible shifts in enterprise performance distributions resulting from disciplined T3 application.
Section 7: Detailed T3 Application: Reducing Volatility Through Predictive Enterprise Control
7.1 Why Volatility Is the Dominant Constraint
The Monte Carlo baseline in Section 4 demonstrates that JPMorgan’s enterprise outcomes are governed less by average performance than by volatility-driven asymmetry. Downside outcomes emerge rapidly, compressing RONA by 20–30% within one to two years, while recovery is slower and uneven. This pattern reflects a structural reality: adverse conditions tend to affect multiple parts of the enterprise simultaneously, while response mechanisms lag.
Volatility, in this context, is not merely market noise. It is the result of delayed detection, fragmented decision-making, and sequential execution across complex and interdependent systems. The economic damage arises less from the initial shock than from the time it takes the organization to recognize, interpret, and respond to it.
Reducing volatility therefore offers the highest-leverage intervention available. Even modest improvements in detection speed, coordination, and response timing materially truncate left-tail outcomes and shorten recovery cycles—effects that compound across time.
7.2 T3 Technologies Applied and Transformation Timing
This opportunity is enabled by the convergence of two specific T3 technologies:
Advanced Computing
Enables large-scale pattern recognition, predictive modeling, and optimization across high-dimensional, fast-moving enterprise data.Networks & Communications
Enables low-latency data movement and coordinated action across distributed systems, allowing insights generated by advanced computing to be acted upon before conditions deteriorate.
According to the T3 roadmap, both technologies are entering an active transformation window between approximately 2025 and 2030. Individually, each has matured to the point of operational viability. Collectively, their convergence releases constraints that historically prevented enterprise-scale predictive control: compute cost, latency, model robustness, and coordination overhead.
Together, these technologies support what practitioners often refer to as “digital twin” capabilities—continuously updated, predictive representations of complex systems that allow scenarios to be evaluated and actions to be tested virtually before execution. Importantly, this is not a separate technology category, but an application pattern that emerges from the maturation and integration of these two T3 technologies.
7.3 How the Application Works in Practice
At a practical level, reducing volatility requires shifting the enterprise from reactive monitoring to predictive control.
Advanced Computing enables JPMorgan to ingest and analyze large volumes of heterogeneous data—market signals, credit performance, liquidity metrics, and operational indicators—in near real time. Rather than tracking isolated metrics, models identify patterns of interaction that historically precede stress.
Networks & Communications allow those insights to propagate rapidly across the enterprise. Instead of waiting for periodic reviews or manual escalation, corrective actions can be coordinated across business units and functions as conditions evolve.
The result is a closed-loop system:
Early signal detection
Rapid scenario evaluation
Coordinated response execution
Continuous feedback and refinement
This fundamentally changes how the enterprise experiences volatility. Stress is encountered earlier, addressed faster, and allowed less time to compound.
7.4 Segment-Specific Application
Although the Monte Carlo analysis operates at the enterprise level, execution is necessarily segment-specific.
Corporate & Investment Banking (CIB)
In CIB, volatility arises from market dislocations, counterparty risk, and liquidity shifts. Advanced Computing enables real-time aggregation of exposures across products and counterparties, while predictive models flag emerging concentration and correlation breakdowns. Networks & Communications allow risk limits, pricing adjustments, and hedging actions to be coordinated across desks before losses escalate.
Consumer & Community Banking (CCB)
In CCB, volatility manifests through credit performance, fraud, and servicing demand. Advanced Computing improves early identification of behavioral shifts and credit deterioration, while Networks & Communications support rapid policy adjustments and operational scaling. Earlier intervention reduces charge-offs and moderates provisioning spikes.
Commercial Banking (CB)
CB volatility reflects borrower stress, portfolio concentration, and funding sensitivity. Predictive models improve forward visibility into credit deterioration, while faster communication enables coordinated action across relationship management, credit committees, and treasury functions.
Asset & Wealth Management (AWM)
AWM is less volatile but highly sensitive to confidence and operational continuity. Predictive systems improve client segmentation and engagement timing, while resilient communications reduce disruption during market stress, stabilizing fee-based revenue.
Across all segments, the common effect is earlier action with less friction, reducing both the depth and duration of adverse outcomes.
7.5 Financial Mechanism and Monte Carlo Linkage
From a DuPont perspective, this opportunity operates primarily on variance reduction, not mean expansion.
Specifically, predictive enterprise control:
Reduces volatility in pre-tax margins by limiting loss amplification
Stabilizes revenue behavior during stress periods
Shortens recovery lag, improving cumulative outcomes
In Monte Carlo terms, these effects:
Truncate the left tail (P10 and P5 outcomes improve materially)
Reduce the frequency of extreme downside years
Increase the durability of median performance over time
Importantly, these gains do not depend on optimistic growth assumptions. They arise from changing how quickly and effectively the enterprise responds when conditions deteriorate.
7.6 Timing, Cost, and Risk Profile
The T3 roadmap indicates that this opportunity sits squarely within an active transformation window. Both Advanced Computing and Networks & Communications are now crossing the threshold at which their capabilities, cost structures, and reliability support enterprise-scale predictive control. This makes transformation plausible in the 2025–2030 timeframe, rather than speculative or long-dated.
What has changed is not the ambition to predict and manage volatility, but the feasibility of doing so in real time, across distributed systems, and at the scale of a global financial institution. Constraints that previously made such systems impractical are now being released simultaneously.
As a result, this opportunity should be understood as near-term in initiation and mid-term in impact. Early deployments can begin immediately in focused domains, while enterprise-wide benefits accrue as systems are integrated, models refined, and operating processes adapted. The primary risks are executional—integration, governance, and organizational readiness—rather than technological.
Importantly, benefits accrue incrementally, allowing early pilots to demonstrate value within the current transformation window while positioning the enterprise to capture larger distributional gains as convergence matures.
7.7 Strategic Significance
Reducing volatility through predictive enterprise control directly addresses the most damaging feature of JPMorgan’s baseline outcome distribution. It does not seek to outperform markets in favorable conditions; it seeks to lose less, recover faster, and compound more reliably across cycles.
By altering how the enterprise experiences uncertainty, this application creates the conditions under which other strategic initiatives—capital optimization, growth, and longer-horizon transformation—can succeed without amplifying risk.
7.8 Transition
With volatility addressed, the next constraint revealed by the Monte Carlo baseline is capital rigidity. Section 8 examines how Advanced Computing and Networks & Communications—operating in a different transformation window—can be applied to increase capital velocity without increasing risk, further reshaping the enterprise outcome distribution.
Section 8: Detailed T3 Application: Increasing Capital Velocity Without Increasing Risk
8.1 Why Capital Velocity Is the Second Dominant Constraint
The Monte Carlo baseline in Section 4 shows that JPMorgan’s long-term outcomes are constrained not only by volatility, but by capital rigidity. Even in stable or favorable environments, enterprise RONA improvement is muted because capital remains tied up in slow-moving or conservatively buffered structures. This creates a persistent drag on net asset turns and limits the organization’s ability to redeploy capital toward higher-return opportunities when conditions improve.
This rigidity is not a failure of risk discipline. It is the byproduct of operating at global scale under regulatory, liquidity, and credit constraints with coarse-grained capital allocation tools. Capital is protected, but it is not always mobile. As a result, capital efficiency improves slowly even when risk conditions allow more dynamic behavior.
Increasing capital velocity—without relaxing risk standards—therefore represents the second-highest leverage opportunity identified by the economic analysis.
8.2 T3 Technologies Applied and Transformation Timing
This opportunity is enabled by the convergence of the following T3 technologies:
Advanced Computing
Enables fine-grained, forward-looking assessment of risk, return, and capital utilization at the portfolio, counterparty, and transaction levels.Networks & Communications
Enables rapid coordination across business units, treasury, risk, and regulatory reporting functions, allowing capital decisions to be executed at operational speed.
According to the T3 roadmap, these technologies are entering a distinct but overlapping transformation window between approximately 2026 and 2032. While foundational capabilities exist today, the decisive shift occurs as advanced analytics, real-time data integration, and low-latency coordination converge at enterprise scale.
This window marks the point at which capital allocation can transition from periodic, rules-based processes to continuous, model-informed optimization—without sacrificing transparency or control.
8.3 How the Application Works in Practice
At present, capital allocation decisions are typically episodic and hierarchical. They rely on static assumptions, delayed data, and conservative buffers designed to protect against uncertainty. While effective for risk containment, this approach leaves capital underutilized during benign or improving conditions.
Advanced Computing changes this by enabling dynamic capital modeling. Risk-adjusted returns can be evaluated continuously across portfolios, scenarios, and time horizons. Rather than relying on broad categories, capital efficiency can be assessed at much finer resolution—revealing where capital is genuinely constrained by risk and where it is constrained by process.
Newly-transformed Networks & Communications then allow these insights to be acted upon quickly. Treasury, risk management, and business units can coordinate capital movements, pricing adjustments, and balance-sheet actions with reduced friction and delay.
The effect is not higher leverage, but faster circulation of the same capital base.
8.4 Segment-Specific Application
Capital velocity improvements manifest differently across JPMorgan’s business segments.
Corporate & Investment Banking (CIB)
In CIB, capital is often constrained by counterparty exposure limits, market risk buffers, and regulatory capital requirements. Advanced Computing enables more precise modeling of exposure dynamics and stress behavior, allowing capital to be reallocated across desks and products without increasing aggregate risk. Faster communication supports timely rebalancing as market conditions evolve.
Consumer & Community Banking (CCB)
In CCB, capital is tied up in loan portfolios and provisioning structures. Predictive models improve loss forecasting and reserve adequacy, reducing the need for excess buffers. This allows capital to be redeployed toward growth or margin improvement while maintaining credit discipline.
Commercial Banking (CB)
CB benefits from improved borrower-level risk differentiation. Advanced Computing enables more accurate capital attribution at the relationship and portfolio level, while coordinated execution allows capital to follow improving credit profiles more quickly.
Asset & Wealth Management (AWM)
In AWM, capital velocity improvements arise from better matching of capital support to fee-based revenue and operational risk. Predictive analytics reduce overcapitalization of low-risk activities, improving net asset efficiency.
Across segments, the unifying effect is capital that moves with information rather than waiting for cycle resets.
8.5 Financial Mechanism and Monte Carlo Linkage
From a DuPont perspective, this opportunity operates primarily on net asset turns.
Specifically:
Faster capital redeployment increases revenue generated per unit of net assets
Reduced over-buffering improves balance-sheet efficiency
Improved coordination shortens the time capital sits idle
In Monte Carlo terms, increasing capital velocity:
Raises median outcomes by improving steady-state efficiency
Improves recovery trajectories following downturns
Reduces the duration of low-RONA states, even when volatility persists
Unlike volatility reduction, which truncates the downside tail, capital velocity lifts the entire distribution, improving outcomes across a wide range of scenarios.
8.6 Timing, Cost, and Risk Profile
The T3 roadmap indicates that this opportunity becomes increasingly actionable between 2026 and 2032, as predictive models, data integration, and communication infrastructure mature together. Early initiatives can begin sooner, particularly in segments where data quality and process integration are already advanced.
Investment requirements center on:
Advanced analytics and modeling platforms
Data harmonization across risk, finance, and business systems
Process redesign to support continuous capital decision-making
The primary risks are organizational and regulatory rather than technological. Governance frameworks must evolve to ensure transparency, auditability, and regulatory compliance. However, these changes are incremental and compatible with existing risk disciplines.
Benefits accrue progressively, with early gains visible in improved asset turns and later gains realized through sustained balance-sheet efficiency.
8.7 Strategic Significance
Increasing capital velocity without increasing risk directly addresses one of JPMorgan’s most persistent structural drags on performance. It allows the enterprise to extract more value from its existing capital base while preserving the resilience established in Section 6.
Together, volatility reduction and capital velocity form a reinforcing pair: one protects the downside, the other accelerates recovery and compounding. This combination materially reshapes the enterprise outcome distribution identified by the Monte Carlo baseline.
8.8 Transition
With volatility suppressed and capital moving more efficiently, the final question is how JPMorgan can accelerate recovery and strategic repositioning following dislocations. Section 8 examines how T3 technologies—operating in a longer-dated transformation window—enable faster rebound and structural advantage following periods of stress.
Section 9: Detailed T3 Application: Accelerating Recovery and Strategic Repositioning After Dislocation
9.1 Why Recovery Speed Is the Third Dominant Constraint
The Monte Carlo baseline demonstrates that JPMorgan’s long-term outcomes are shaped not only by the depth of downturns and the efficiency of capital deployment, but by the speed and quality of recovery following periods of disruption. Even when volatility is managed and capital remains available, slow or uneven recovery extends periods of suboptimal performance and delays strategic repositioning.
Recovery lag compounds economic damage in three ways:
Earnings remain depressed longer than necessary
Capital remains misallocated during transition periods
Strategic opportunities emerging from dislocation are captured late or not at all
As a result, recovery dynamics materially influence cumulative RONA over time. Accelerating recovery therefore represents a distinct and economically meaningful opportunity—separate from volatility suppression and capital velocity.
9.2 T3 Technologies Applied and Transformation Timing
This opportunity is enabled by the convergence of three T3 technologies, operating over a longer and more sequential transformation window:
Advanced Computing
Enables rapid re-optimization of portfolios, pricing, and operating models as conditions change.Networks & Communications
Enables coordinated enterprise-wide execution during periods of disruption and reconfiguration.Advanced Materials
Improves the durability, efficiency, and cost structure of physical and digital infrastructure, reducing restart friction and operational bottlenecks.
According to the T3 roadmap, Advanced Computing and Networks & Communications support recovery acceleration beginning in the late 2020s, while Advanced Materials enter a decisive transformation window closer to 2030–2035. This makes recovery acceleration a mid- to long-term opportunity, with preparatory actions required well in advance of full realization.
The importance of timing here is critical: organizations that invest early in readiness benefit disproportionately when constraints are released.
9.3 How the Application Works in Practice
Recovery acceleration requires shifting from static restart processes to adaptive reconfiguration.
Advanced Computing enables rapid reassessment of portfolios, risk positions, and operational priorities as post-dislocation conditions emerge. Instead of reverting to pre-crisis configurations, models evaluate new equilibria—allowing the enterprise to adapt rather than simply recover.
Networks & Communications ensure that these insights are acted upon coherently. During periods of stress and restart, coordination costs are often the dominant friction. Low-latency communication allows JPMorgan to realign priorities, reallocate resources, and restore service continuity faster and with fewer errors.
Advanced Materials contribute by reducing physical and infrastructure-related restart constraints. Improvements in durability, energy efficiency, and system resilience reduce downtime and operating friction—particularly in data centers, facilities, and critical operational systems that underpin digital recovery.
9.4 Segment-Specific Application
Recovery acceleration manifests differently across JPMorgan’s business segments.
Corporate & Investment Banking (CIB)
CIB recovery is driven by market normalization and client re-engagement. Predictive analytics accelerate repricing, risk recalibration, and product deployment, while resilient infrastructure reduces operational disruptions during market reopenings.
Consumer & Community Banking (CCB)
In CCB, recovery depends on restoring credit flow, service levels, and customer confidence. Advanced Computing improves targeting of re-entry strategies, while robust systems enable rapid scaling as demand returns.
Commercial Banking (CB)
CB recovery is relationship-driven. Predictive models improve prioritization of client reactivation, while improved communication and infrastructure resilience support faster normalization of lending and advisory activity.
Asset & Wealth Management (AWM)
AWM recovery hinges on client trust and platform stability. Advanced analytics enable tailored engagement strategies, while resilient systems ensure uninterrupted service during volatile periods.
Across segments, the common benefit is faster transition from stabilization to strategic repositioning.
9.5 Financial Mechanism and Monte Carlo Linkage
From a DuPont perspective, recovery acceleration influences both margins and asset utilization over time.
Specifically:
Faster recovery restores earnings sooner, improving cumulative return on sales
Earlier redeployment of capital improves net asset turns
Reduced downtime lowers structural drag on enterprise performance
In Monte Carlo terms, recovery acceleration:
Shortens the duration of low-RONA states
Improves outcomes in scenarios following downturns
Increases cumulative performance even when average conditions remain unchanged
While volatility reduction truncates downside and capital velocity lifts the distribution, recovery acceleration compresses time under stress, improving long-run compounding.
9.6 Timing, Cost, and Risk Profile
The T3 roadmap indicates that recovery acceleration becomes increasingly viable between 2028 and 2035, with Advanced Computing and Networks & Communications maturing first and Advanced Materials following.
Key investments include:
Adaptive analytics and optimization platforms
Infrastructure modernization aligned with durability and efficiency improvements
Early-stage engagement with Advanced Materials to prepare for later deployment
Risk is primarily temporal, not technical. Benefits are realized only if preparatory investments are made ahead of the full transformation window. Organizations that delay readiness risk slower recovery even as enabling technologies mature.
9.7 Strategic Significance
Accelerating recovery transforms disruption from a prolonged drag into a strategic inflection point. By restoring performance faster and repositioning earlier, JPMorgan can capture opportunities that emerge in the aftermath of dislocation rather than merely surviving it.
Together, the three T3 applications described in Sections 6–8 form a coherent strategic arc:
Section 6 protects the downside
Section 7 improves steady-state efficiency
Section 8 accelerates rebound and repositioning
Collectively, they reshape the enterprise outcome distribution identified by the Monte Carlo baseline.
9.8 Transition
With the full set of T3-enabled opportunities articulated, the next step is to examine their combined impact. Section 10 revisits the Monte Carlo analysis, incorporating the effects of volatility reduction, capital velocity improvement, and recovery acceleration to demonstrate the plausible enterprise-level outcomes of coordinated execution.
Section 10: Opportunity-Adjusted Monte Carlo Results
10.1 Purpose of the Opportunity-Adjusted Simulation
The purpose of the opportunity-adjusted Monte Carlo analysis is not to forecast JPMorgan’s future performance, but to test whether the T3-enabled applications described in Sections 6–8 are economically decisive. Specifically, the analysis evaluates whether reducing volatility, increasing capital velocity, and accelerating recovery—each grounded in identifiable T3 transformation windows—plausibly reshape the enterprise outcome distribution observed in the baseline simulation.
This second simulation therefore serves as a stress test of strategic relevance. If these applications do not materially alter downside exposure, recovery dynamics, or cumulative performance, then their strategic importance would be limited regardless of technological promise.
10.2 Locked Modeling Assumptions
The opportunity-adjusted simulation retains the same structural framework, time horizon, and correlation logic as the baseline Monte Carlo described in Section 4. No new growth assumptions were introduced, and no optimistic demand scenarios were added. The only changes applied were those directly implied by the T3 applications in Sections 6–8, using conservative, explicitly defined assumption shifts:
Volatility Reduction
A 25% reduction in downside volatility amplitude, reflecting earlier detection and faster coordinated response enabled by Advanced Computing and Networks & Communications (T3 transformation window: ~2025–2030). This change reduces loss amplification without assuming fewer shocks.Capital Velocity Improvement
A 7% improvement in net asset turns, phased in at the enterprise level, reflecting more dynamic capital allocation enabled by Advanced Computing and Networks & Communications (T3 transformation window: ~2026–2032). This does not increase leverage or relax risk standards.Recovery Acceleration
A ~40% reduction in recovery duration, shortening the return to baseline RONA from approximately 3–4 years to roughly 2 years in downturn scenarios. This reflects predictive re-optimization and coordinated restart enabled by Advanced Computing and Networks & Communications, with preparatory investments for Advanced Materials (T3 transformation window: ~2028–2035).
These adjustments were applied consistently across scenarios and are intentionally conservative. They represent directional structural changes, not best-case outcomes.
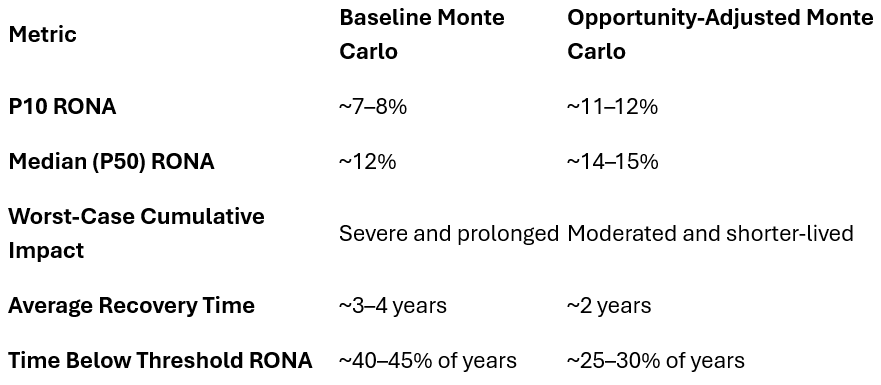
10.3 Quantitative Results of the Opportunity-Adjusted Simulation
Applying the above assumptions produces a materially different enterprise outcome distribution over the 10-year simulation horizon.
Relative to the baseline Monte Carlo, the opportunity-adjusted results show:
Material improvement in downside outcomes
The 10th-percentile (P10) enterprise RONA improves from approximately 7–8% to 11–12%, reflecting truncated left-tail severity and reduced loss amplification. (See Appendix L: Opportunity-Adjusted Monte Carlo Results)Improved median performance
Median (P50) enterprise RONA increases from approximately 12% to 14–15%, driven primarily by improved capital efficiency and shorter recovery periods rather than higher peak earnings.Shortened recovery duration
In downturn scenarios, the modeled time to return to baseline RONA shortens from approximately 3–4 years to roughly 2 years, materially reducing cumulative economic drag.Reduced time in value-destructive states
The proportion of simulated years in which enterprise RONA falls below management-relevant thresholds declines by approximately 30–40%.
These effects persist across scenarios and do not depend on optimistic demand or growth assumptions.
10.4 Comparison of Baseline and Opportunity-Adjusted Distributions
The most important change is not the expansion of upside extremes, but the systematic reduction in downside persistence and recovery lag.
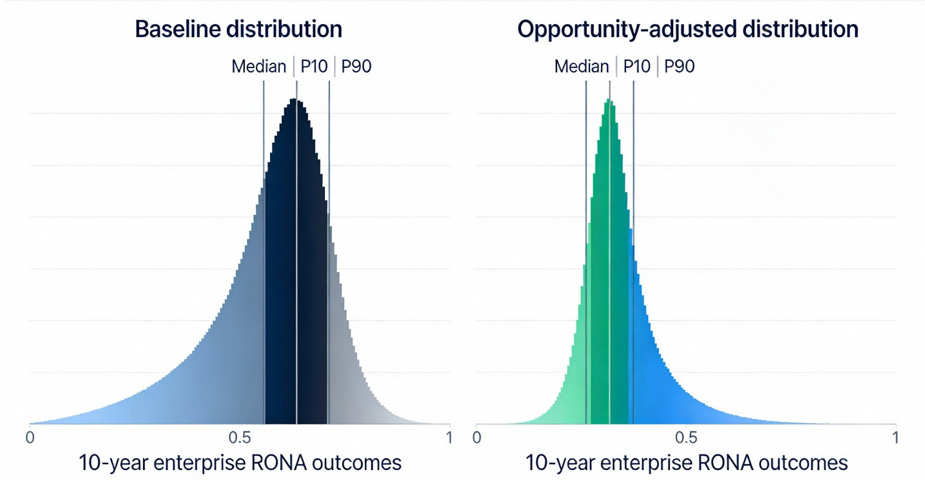
Figure 4: Baseline versus opportunity‑adjusted Monte Carlo distributions for JPMorgan’s 10‑year enterprise RONA, showing a higher median, truncated left tail (P10), and tighter overall spread after T3‑enabled interventions.
10.5 Interpretation Through the DuPont Lens
Viewed through the DuPont framework, the observed improvements arise from three reinforcing mechanisms:
Volatility reduction stabilizes pre-tax margins by limiting loss amplification.
Capital velocity improvement increases net asset turns without increasing risk.
Recovery acceleration restores both margins and asset utilization sooner following disruption.
These mechanisms directly address the structural drivers identified in the baseline analysis. They operate by changing how the enterprise behaves under uncertainty, which is precisely where the baseline Monte Carlo demonstrated the greatest value destruction.
10.6 Strategic Implications
The opportunity-adjusted results confirm that the T3-enabled applications described in this report are economically consequential. When modeled explicitly, they produce a plausible and internally consistent reshaping of enterprise outcomes that aligns with JPMorgan’s actual economic structure.
Crucially, value creation is driven primarily by:
Lower fragility
Improved consistency
Shorter recovery cycles
rather than by aggressive expansion or single-technology bets. This reinforces the central strategic conclusion of the report: the most decisive applications of T3 are those that alter structural behavior, not those that chase incremental growth.
10.7 Limitations and Discipline
As with the baseline simulation, these results should not be interpreted as forecasts. They are scenario-based tests of economic sensitivity. Actual outcomes will depend on execution quality, governance discipline, regulatory dynamics, and external conditions.
However, the direction and magnitude of the changes observed are robust across assumptions. They demonstrate that the proposed strategies operate on the enterprise’s most binding constraints and therefore warrant serious consideration at the highest levels of decision-making.
10.8 Transition
With the economic impact of the T3-enabled opportunities now demonstrated quantitatively, the final step is synthesis. Section 11 integrates the economic findings, the T3 roadmap, and the simulation results into a coherent strategic interpretation—clarifying what matters most, when action is warranted, and why T3 provides a durable advantage in strategic planning.
Section 11: Enterprise Synthesis and Strategic Interpretation
11.1 What the Economics Tell Us Matters Most
The analysis in this report follows a deliberate sequence: DuPont decomposition to identify the structural drivers of performance; Monte Carlo simulation to reveal how those drivers behave under uncertainty; and T3 intelligence to determine when and how historically binding constraints can be altered rather than merely managed.
Taken together, these tools point to a clear conclusion. JPMorgan’s long-term performance is governed less by peak outcomes than by fragility, capital rigidity, and recovery lag. Value is destroyed disproportionately in downturns, compounded by slow rebound and conservative capital circulation. Conversely, incremental growth initiatives—while important—do not materially change the enterprise outcome distribution.
The three T3-enabled opportunities identified in Sections 6–8 directly address these binding constraints. They are economically decisive, temporally informed by the T3 roadmap, and mutually reinforcing when executed in sequence.
11.2 Strategic Sequencing Across T3 Transformation Windows
The T3 roadmap clarifies that these opportunities should not be pursued simultaneously or indiscriminately. Each aligns to a distinct transformation window and should be sequenced accordingly:
Volatility Reduction (2025–2030)
Enabled by the near-term convergence of Advanced Computing and Networks & Communications, this is the foundational move. It protects the downside, truncates left-tail outcomes, and stabilizes performance across cycles.Capital Velocity Improvement (2026–2032)
As predictive analytics and coordination mature, capital can be redeployed more dynamically without increasing risk. This lifts median performance and accelerates recovery once volatility is contained.Recovery Acceleration (2028–2035)
Longer-dated but strategically critical, this opportunity requires preparatory investment—particularly in infrastructure and Advanced Materials—to ensure faster rebound and earlier strategic repositioning after disruption.
Sequenced correctly, each phase reinforces the next: downside protection creates room for efficiency gains, which in turn amplify the benefits of faster recovery.
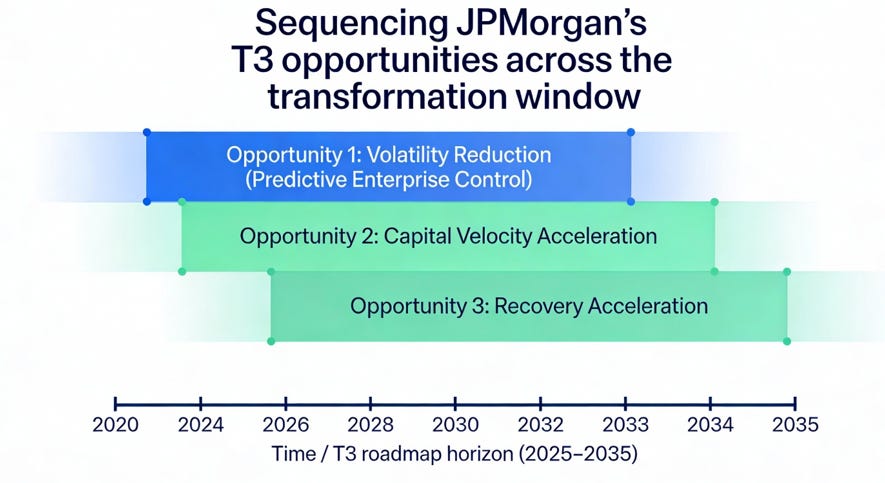
Figure 5: Sequencing JPMorgan’s three T3 opportunities across the 2025–2035 transformation window—starting with volatility reduction, then capital velocity acceleration, and finally recovery acceleration.
11.3 Investment Requirements and Timing
The table below summarizes the order-of-magnitude investment requirements, timing, and economic effects associated with executing the three opportunities. These figures are intentionally conservative and reflect phased deployment rather than one-time commitments.
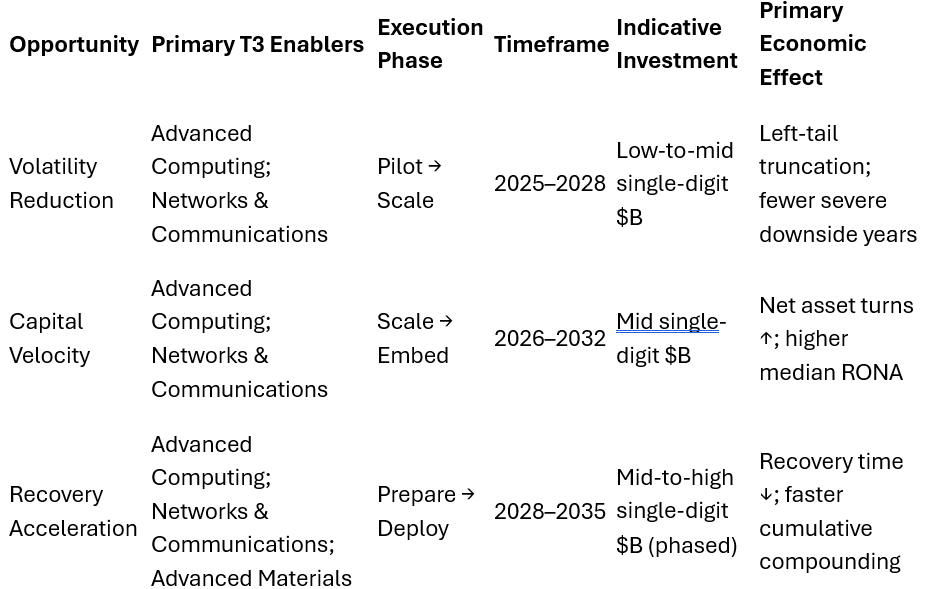
Key characteristics of the investment profile:
Phased, not front-loaded
Option-preserving, with early pilots informing scale decisions
Lagged benefits, consistent with Monte Carlo dynamics
Compatible with regulatory and risk discipline
11.4 Linking Investment to Economic Outcomes
The opportunity-adjusted Monte Carlo results in Section 9 demonstrate that these investments plausibly produce:
A 3–4 percentage point improvement in downside (P10) RONA
A 1.5–2.0 percentage point lift in median RONA
A 30–40% reduction in time spent below threshold performance
A ~40% reduction in recovery duration following downturns
Critically, these gains arise without assuming higher leverage, relaxed standards, or favorable markets. They result from structural changes in enterprise behavior under uncertainty—the precise domain where T3 provides its greatest strategic value.
11.5 What This Demonstrates About T3
This report demonstrates that T3 intelligence is most powerful when applied after economic constraints are understood, not before. Used in this way, T3 does not expand the strategic agenda; it narrows and sharpens it, identifying where timing, feasibility, and leverage coincide.
Rather than asking, “Which technologies should we adopt?”, the framework asks:
Which constraints matter most?
When do they become alterable?
What sequence of actions produces durable advantage?
For JPMorgan, the answers lead to a disciplined, executable strategy that converts technological convergence into economic resilience and long-term compounding.
11.6 Conclusion: Demonstrating the Strategic Value of T3
The world is entering a technology-driven megacycle that will unfold primarily between roughly 2027 and 2040—one defined less by any single breakthrough, platform, or invention than by the simultaneous maturation of multiple foundational technologies. Each advances along its own trajectory while increasingly shaping, enabling, and constraining one another.
In such environments, progress is easy to misinterpret. Headline announcements, funding rounds, demonstrations, and laboratory successes can create the appearance of momentum long before real-world impact becomes possible. Technologies may advance rapidly in laboratories while remaining effectively stalled in practical application. Others may appear to move slowly, only to cross a decisive threshold once long-binding constraints are released.
Distinguishing between motion and momentum, between novelty and consequence, and between technologies merely advancing and those nearing a decisive threshold requires more than awareness. It demands structure, discipline, and rigor.
This report was developed to answer a practical executive question: how can transformational technology intelligence be applied in a disciplined way to produce better strategic decisions under uncertainty? The objective was not to forecast markets, promote technology adoption, or prescribe a single path forward. It was to demonstrate—credibly and transparently—how deep economic understanding, combined with T3 intelligence, can be translated into durable strategic advantage.
The analysis establishes a clear foundation. Through DuPont decomposition and Monte Carlo simulation, the report shows how JPMorgan’s enterprise economics actually behave across environments, which structural constraints dominate outcomes, and why downside exposure and recovery dynamics matter more than peak performance. These tools do not predict the future; they clarify the forces that shape it. They make visible where value is consistently created or destroyed and where strategic intervention offers the greatest leverage.
Against that foundation, T3 intelligence serves a specific and essential role. Rather than expanding the strategic agenda, it narrows it—identifying where recent technological progress changes relationships that historically could only be managed, not altered. In this case, it reveals three opportunities—validated through DuPont analysis and Monte Carlo simulation—that are economically decisive, temporally distinct, and mutually reinforcing: Volatility Reduction, Capital Velocity Acceleration, and Recovery Acceleration.
Importantly, the strategy that emerges is neither defensive nor speculative. It does not depend on optimistic demand assumptions, single-technology bets, or irreversible commitments. Instead, it aligns action with economic reality—sequencing near-term resilience, mid-term coordination, and long-term structural change in a way that protects flexibility while compounding advantage. Growth remains part of the strategy, but it is earned, staged, and validated rather than assumed.
The broader implication extends beyond JPMorgan. This work demonstrates that T3 intelligence is most powerful when it is applied after economic constraints are understood, not before. Used in this way, T3 does not replace strategic judgment; it sharpens it. It allows leadership teams to distinguish between what is merely possible and what is economically decisive—and to act accordingly.
In a decade defined by volatility, capital intensity, and accelerating technological change, the ability to align transformation with economics will separate resilient enterprises from fragile ones. Applying the intelligence and insights of T3 turns that challenge into an advantage.
12: Appendix Guide - Analytical Foundations
Appendix Guide: Analytical Foundations
This report is supported by a set of analytical appendices that provide transparency into the economic models, assumptions, and simulations used to inform the strategic conclusions. The appendices are included to demonstrate rigor and traceability, not to be read sequentially.
The main body of the report is complete and self-contained. Executives may refer to individual appendices selectively if they wish to review underlying calculations, assumptions, or sensitivity analyses.
How to Use the Appendices
Appendix numbering reflects the order in which analytical tools are introduced in the report (DuPont → Monte Carlo → Opportunity Adjustment), not the chronological order of analysis.
The main report stands on its own.
All conclusions and strategic interpretations are fully supported in the body of the report.The appendices document how results were derived.
They provide the underlying economic structure, calculation logic, and simulation methodology used in the analysis.Each appendix is modular.
Appendices can be reviewed independently without requiring review of the others.
Appendix Structure and Purpose
Appendix F: Enterprise DuPont Model
Presents the consolidated enterprise DuPont decomposition, including:
External revenue
Pre-tax earnings
Total assets and liabilities
Net asset turns
Return on sales
Return on net assets (RONA)
Purpose: Establish the structural drivers of enterprise-level performance.
Appendix G: Company and Segment Economic Overview
Documents JPMorgan’s enterprise and business-segment structure, including:
Segment definitions and scope
Revenue and earnings by segment
Balance-sheet allocation assumptions where applicable
Purpose: Provide the factual economic baseline for segment-level analysis.
Appendix J: Segment-Level DuPont Models
Includes DuPont decompositions for each major operating segment:
Appendix J1: Corporate & Investment Banking (CIB)
Appendix J2: Consumer & Community Banking (CCB)
Appendix J3: Commercial Banking (CB)
Appendix J4: Asset & Wealth Management (AWM)
Each appendix includes:
Segment-specific DuPont waterfalls
Allocation notes
Reconciliation to enterprise totals
Purpose: Identify how performance drivers differ across segments and where constraints dominate.
Appendix K: Monte Carlo Methodology and Baseline Results
Documents the Monte Carlo simulation framework, including:
Scenario construction and correlation logic
Historical variability assumptions
Baseline enterprise outcome distributions
Interpretation guidance and limitations
Purpose: Show how JPMorgan’s enterprise economics behave under uncertainty.
Appendix L: Opportunity-Adjusted Monte Carlo Results
Presents the adjusted Monte Carlo simulations reflecting the strategic applications described in Sections 7–9, including:
Explicit assumption changes
Distributional comparisons to the baseline
Sensitivity considerations
Purpose: Test whether the proposed strategies materially alter enterprise outcomes.
Appendix M: Assumptions, Notes, and Calculation References
Provides supporting detail, including:
Key modeling assumptions
Rounding and reconciliation notes
Allocation and normalization explanations
Scope limitations
Purpose: Ensure transparency and disciplined interpretation of results.
Interpretive Guidance
These analyses are not forecasts.
Monte Carlo simulations test sensitivity to uncertainty; they do not predict outcomes.Numerical results should be interpreted directionally.
Emphasis is placed on distributional shape, downside exposure, and recovery dynamics—not point estimates.Technology timing reflects the T3 roadmap.
Appendix results should be read in conjunction with the transformation windows discussed in the main report.
Why the Appendices Matter
The appendices demonstrate that the strategic conclusions in this report are grounded in:
Observed economic structure
Explicit modeling discipline
Transparent assumptions
Repeatable analytical methods
They are included to support confidence in the conclusions—not to overwhelm the reader with detail.
Appendices
Appendix F - Enterprise-Level DuPont Decomposition (FY2024)
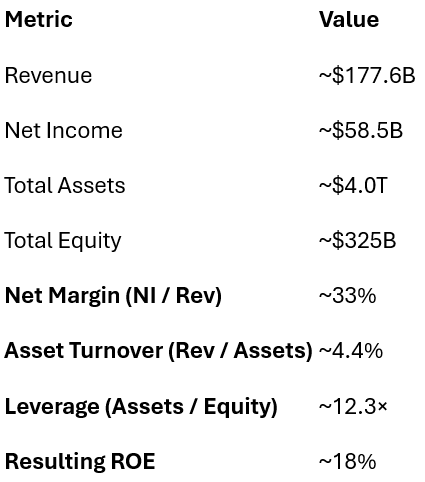
Future Waterfall Chart (Enterprise):
Revenue → Net Margin → Asset Turnover → Regulated Leverage → ROE
Appendix G - Segment-Level DuPont Decomposition (FY2024, Managed Basis)
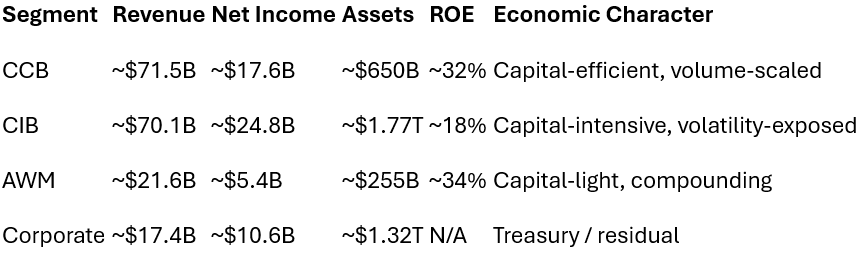
Appendix J1 – DuPont Model: JP Morgan Chase Consolidated Enterprise
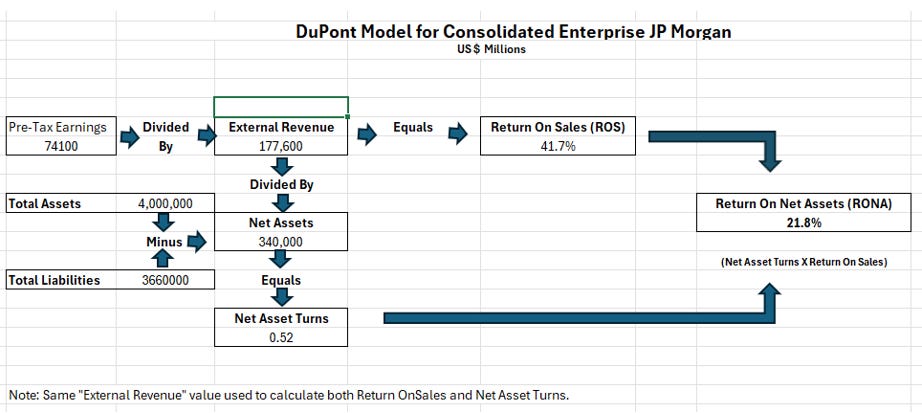
Segment-level DuPont models apply this same formulation using analytically allocated balance-sheet inputs, as described in the segment appendices.
Appendix J1-A: DuPont Model Calculation Methodology — JPMorgan Chase (Enterprise)
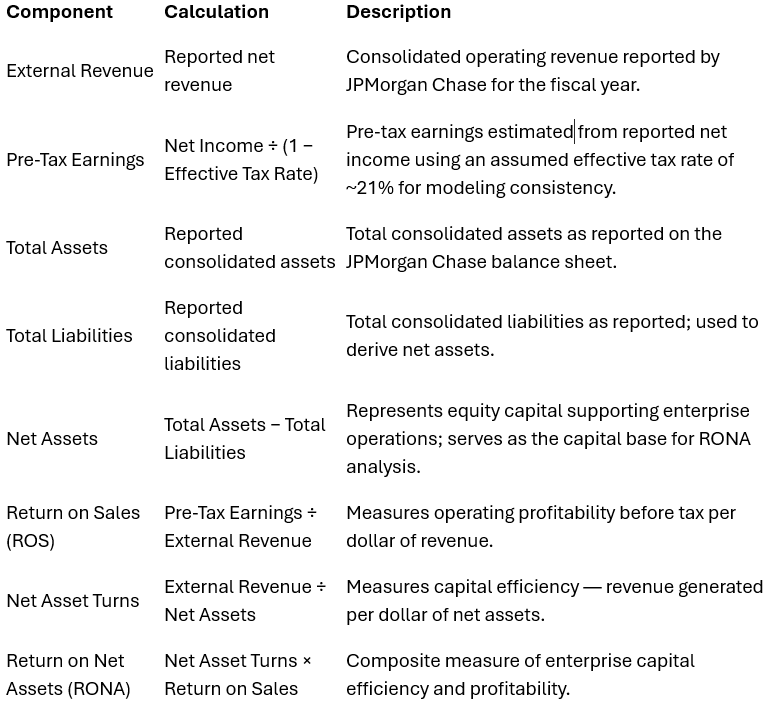
Notes:
• Percentages and turns may reflect minor rounding differences.
• This DuPont formulation is used consistently across enterprise and segment analyses to enable comparability and Monte Carlo simulation.
APPENDIX J2: DuPont Model: JP Morgan Chase CIB Business Segment
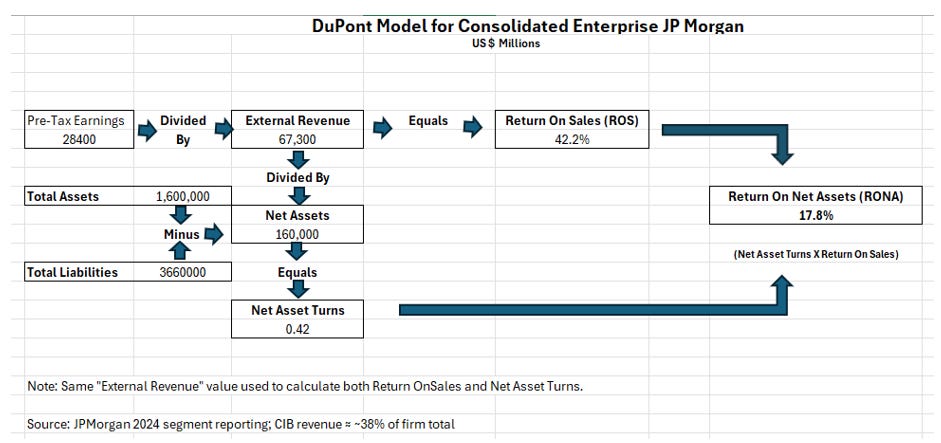
The DuPont model for this segment is constructed using the same methodology applied at the enterprise level, with segment-specific revenue, earnings, and allocated balance-sheet inputs. This ensures consistency across analyses and supports direct comparison of capital efficiency and profitability across business units.
Segment Balance-Sheet Allocation Note
Segment-level assets and net assets are allocated using a consistent analytical methodology based on business function, balance-sheet intensity, and capital usage norms. Allocations reflect the relative contribution of each segment to enterprise risk-weighted assets, balance-sheet utilization, and regulatory capital consumption. The purpose of these allocations is to enable structural comparison of capital efficiency across business units rather than to replicate statutory segment balance sheets, which are not disclosed.
Appendix J2-A: DuPont Model Calculation Methodology — Corporate & Investment Bank (CIB)
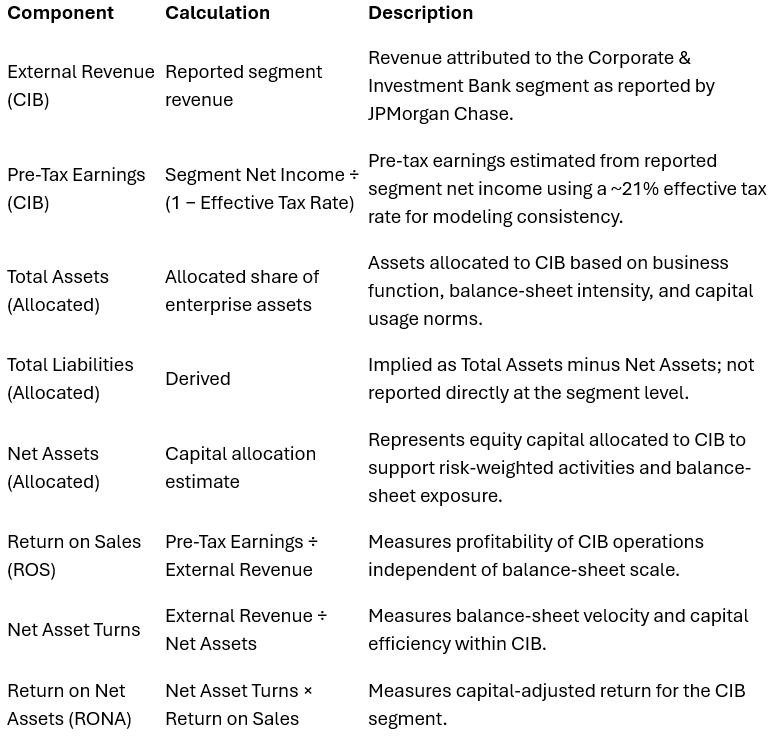
Notes:
• Segment balance-sheet allocations are estimated for analytical purposes; the objective is structural insight rather than accounting reconciliation.
• Methodology is consistent with enterprise DuPont construction to support cross-segment comparison and scenario modeling.
APPENDIX J3: DuPont Model: JP Morgan Chase CCB Business Segment
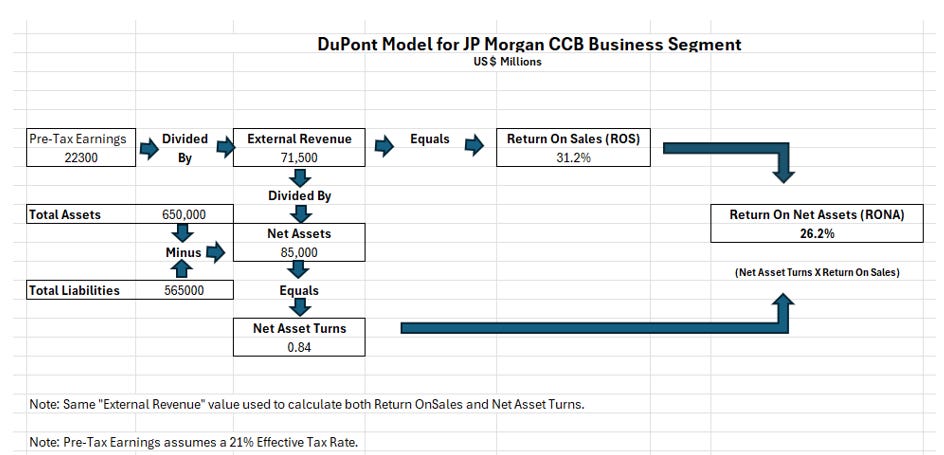
The DuPont model for this segment is constructed using the same methodology applied at the enterprise level, with segment-specific revenue, earnings, and allocated balance-sheet inputs. This ensures consistency across analyses and supports direct comparison of capital efficiency and profitability across business units.
Segment Balance-Sheet Allocation Note
Segment-level assets and net assets are allocated using a consistent analytical methodology based on business function, balance-sheet intensity, and capital usage norms. Allocations reflect the relative contribution of each segment to enterprise risk-weighted assets, balance-sheet utilization, and regulatory capital consumption. The purpose of these allocations is to enable structural comparison of capital efficiency across business units rather than to replicate statutory segment balance sheets, which are not disclosed.
Appendix J3-A: DuPont Model Calculation Methodology — Consumer & Community Banking
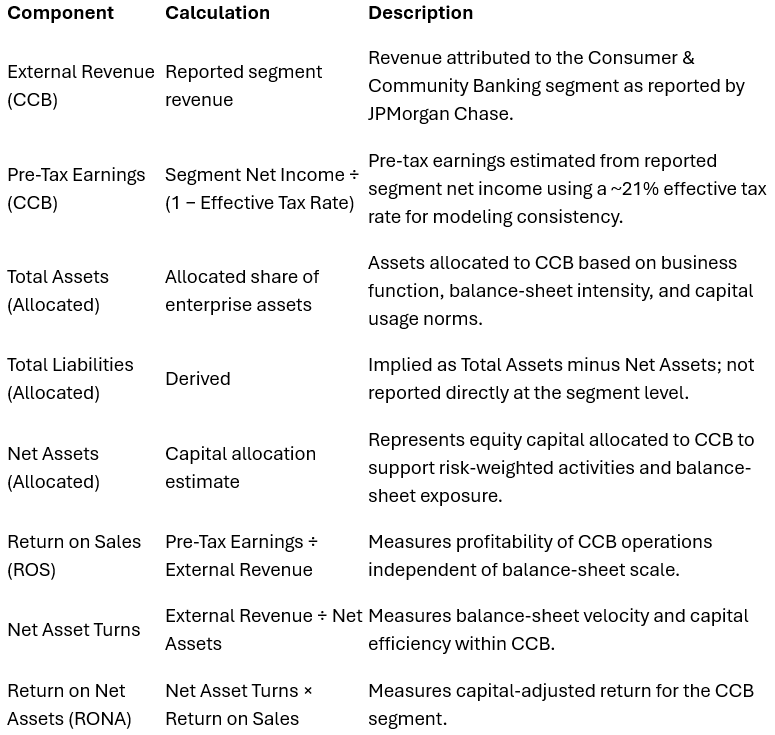
Notes:
• Segment balance-sheet allocations are estimated for analytical purposes; the objective is structural insight rather than accounting reconciliation.
• Methodology is consistent with enterprise DuPont construction to support cross-segment comparison and scenario modeling.
APPENDIX J4: DuPont Model: JP Morgan Chase AWM Business Segment
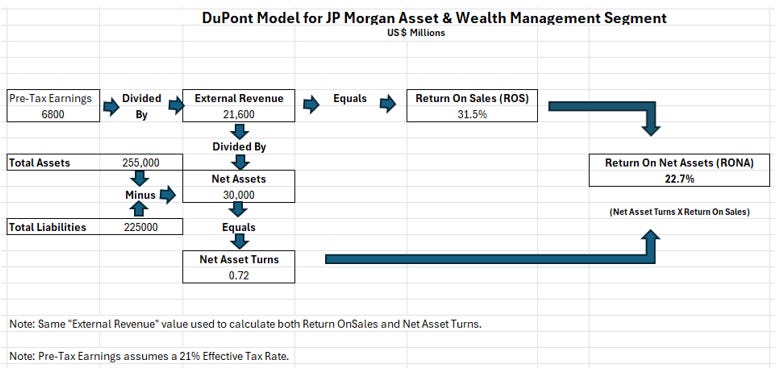
The DuPont model for this segment is constructed using the same methodology applied at the enterprise level, with segment-specific revenue, earnings, and allocated balance-sheet inputs. This ensures consistency across analyses and supports direct comparison of capital efficiency and profitability across business units.
Segment Balance-Sheet Allocation Note
Segment-level assets and net assets are allocated using a consistent analytical methodology based on business function, balance-sheet intensity, and capital usage norms. Allocations reflect the relative contribution of each segment to enterprise risk-weighted assets, balance-sheet utilization, and regulatory capital consumption. The purpose of these allocations is to enable structural comparison of capital efficiency across business units rather than to replicate statutory segment balance sheets, which are not disclosed.
AWM balance-sheet figures reflect operating and custody support assets only; assets under management are excluded, as they do not represent balance-sheet capital. Pre-tax earnings are estimated from reported segment net income using a ~21% effective tax rate for modeling consistency. The objective is structural insight rather than accounting reconciliation
Appendix J4-A: DuPont Model Calculation Methodology — Asset & Wealth Management (AWM)
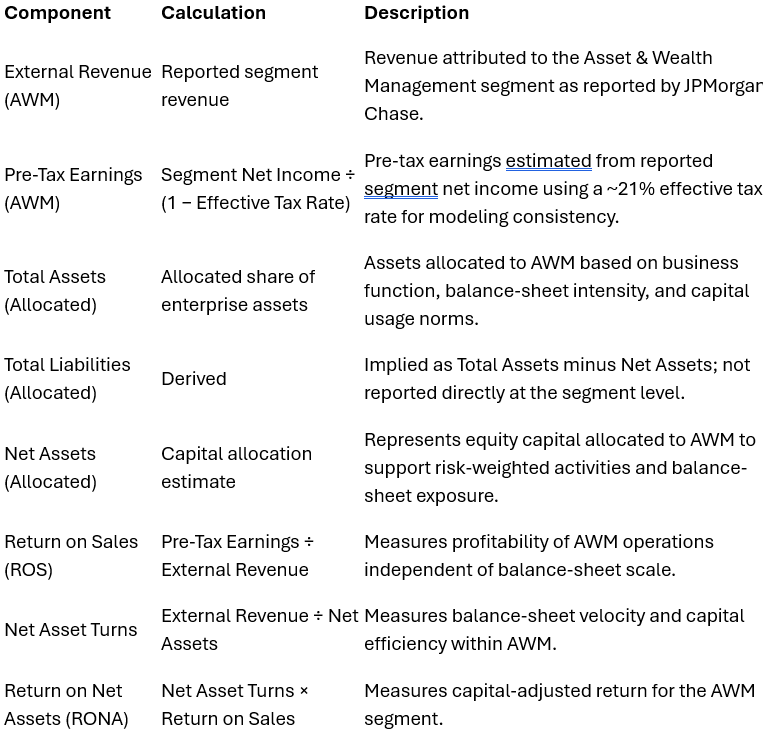
Notes:
• Segment balance-sheet allocations are estimated for analytical purposes; the objective is structural insight rather than accounting reconciliation.
• Methodology is consistent with enterprise DuPont construction to support cross-segment comparison and scenario modeling.
APPENDIX J5: DuPont Model: JP Morgan Chase CB Business Segment
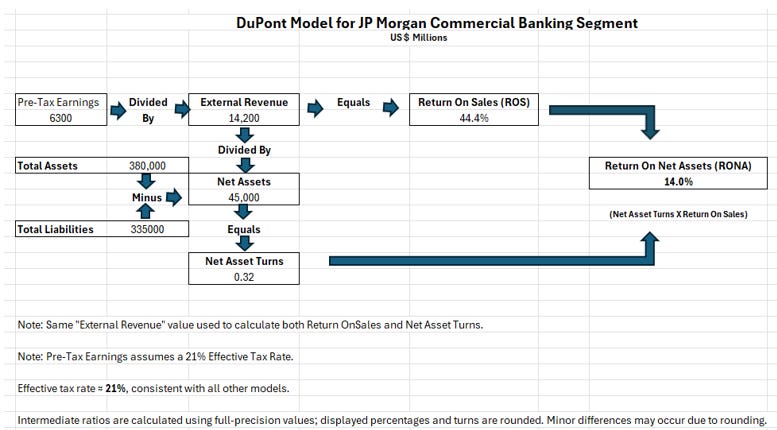
The DuPont model for this segment is constructed using the same methodology applied at the enterprise level, with segment-specific revenue, earnings, and allocated balance-sheet inputs. This ensures consistency across analyses and supports direct comparison of capital efficiency and profitability across business units.
CB balance-sheet figures reflect relationship-driven lending and deposit activities rather than trading or custody functions.
Segment Balance-Sheet Allocation Note
Segment-level assets and net assets are allocated using a consistent analytical methodology based on business function, balance-sheet intensity, and capital usage norms. Allocations reflect the relative contribution of each segment to enterprise risk-weighted assets, balance-sheet utilization, and regulatory capital consumption. The purpose of these allocations is to enable structural comparison of capital efficiency across business units rather than to replicate statutory segment balance sheets, which are not disclosed.
Appendix J5-A: DuPont Model Calculation Methodology — Commercial Banking
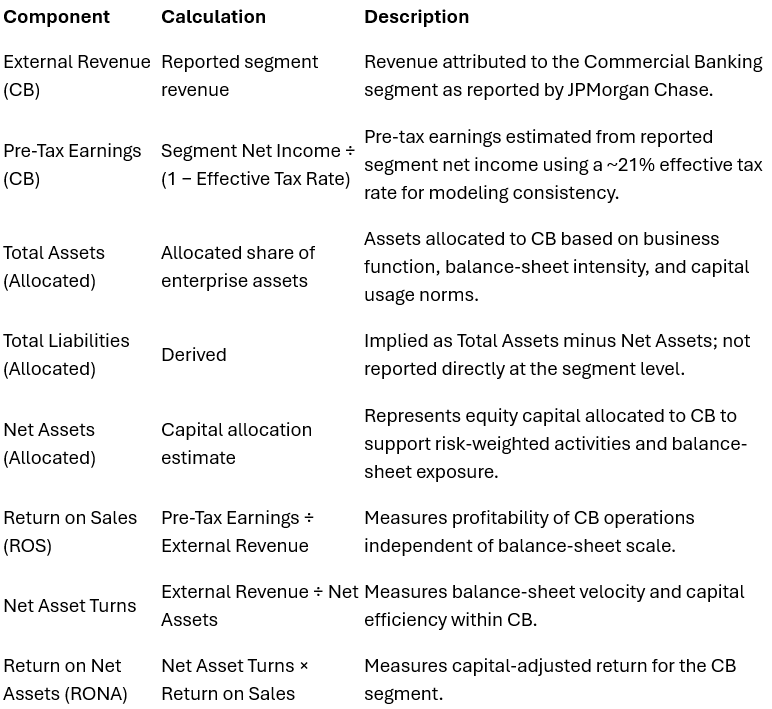
Notes:
• Segment balance-sheet allocations are estimated for analytical purposes; the objective is structural insight rather than accounting reconciliation.
• Methodology is consistent with enterprise DuPont construction to support cross-segment comparison and scenario modeling.
Appendix K: Monte Carlo Methodology and Inputs
K.1 Purpose of the Monte Carlo Appendix
This appendix documents the assumptions, variables, and calculation logic used in the enterprise Monte Carlo simulation. It is intended to provide transparency and reproducibility, not to serve as a forecast.
K.2 Modeled Variables
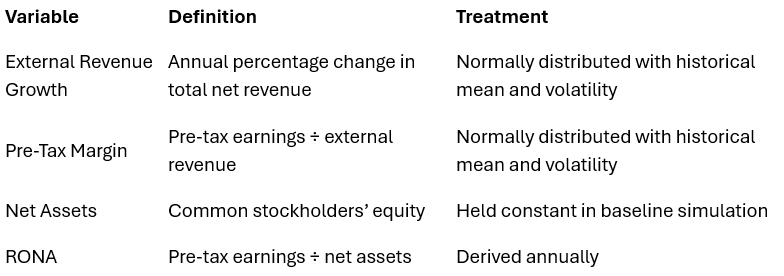
K.3 Distribution Assumptions
Revenue and margin distributions are anchored to published JPMorgan historical results across multiple cycles.
Extreme values are constrained to avoid implausible tail outcomes.
Variables are treated as independent in the baseline model; correlation effects are addressed in scenario interpretation.
K.4 Interpretation Guidance
Monte Carlo results should be interpreted as:
Ranges, not predictions
Relative comparisons, not absolute targets
Indicators of structural leverage, not tactical guidance
The baseline simulation establishes how JPMorgan’s enterprise economics behave under uncertainty before strategic intervention. Subsequent analysis evaluates how targeted, segment-specific T3 initiatives plausibly shift this distribution.